Welcome to our comprehensive guide on how to use Excel, a powerful spreadsheet tool developed by Microsoft. Whether you are a beginner or an experienced user, this article will provide you with essential knowledge and practical tips for unleashing the full potential of Excel. From creating basic spreadsheets to analyzing complex data, we will walk you through every step in a clear and concise manner, ensuring that you develop a solid foundation in using this indispensable software. So, let’s dive in and explore the world of Excel together, empowering you with the skills to organize, calculate, and visualize data with ease.
Getting Started with Excel
Microsoft Excel is a powerful tool that allows you to organize, analyze, and visualize data in a user-friendly way. Whether you’re a beginner or an experienced user, this guide will help you get started with Excel and make the most out of its features.
1. Familiarize Yourself with the Interface:
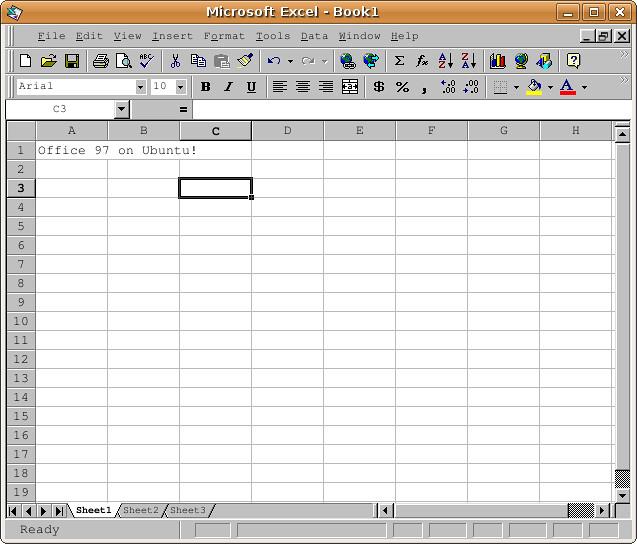
When you launch Excel, you’ll see a grid of cells with columns labeled A, B, C, and rows numbered 1, 2, 3. This grid is called a worksheet. Spend some time getting comfortable with the various tabs and commands on the ribbon, which is located at the top of the window. Familiarize yourself with the Home, Insert, Formulas, Data, Review, and View tabs.
2. Creating and Formatting Data:
Excel is all about working with data, so it’s essential to know how to enter and format data effectively. To enter data, simply click on a cell and start typing. Excel automatically adjusts the width of the columns to fit your data. You can also use various formatting options to make your data stand out, such as changing font styles and sizes, adding borders, and applying cell colors.
3. Mastering Basic Formulas and Functions:
Excel has a wide range of built-in formulas and functions that allow you to perform calculations on your data. To use a formula, start by typing an equals sign (=) in a cell, followed by the desired formula. For example, “=A1+B1” adds the values in cells A1 and B1. You can also use functions like SUM, AVERAGE, and COUNT to perform more complex calculations. Refer to Excel’s help documentation or online tutorials for a comprehensive list of formulas and functions.
4. Working with Charts and Graphs:
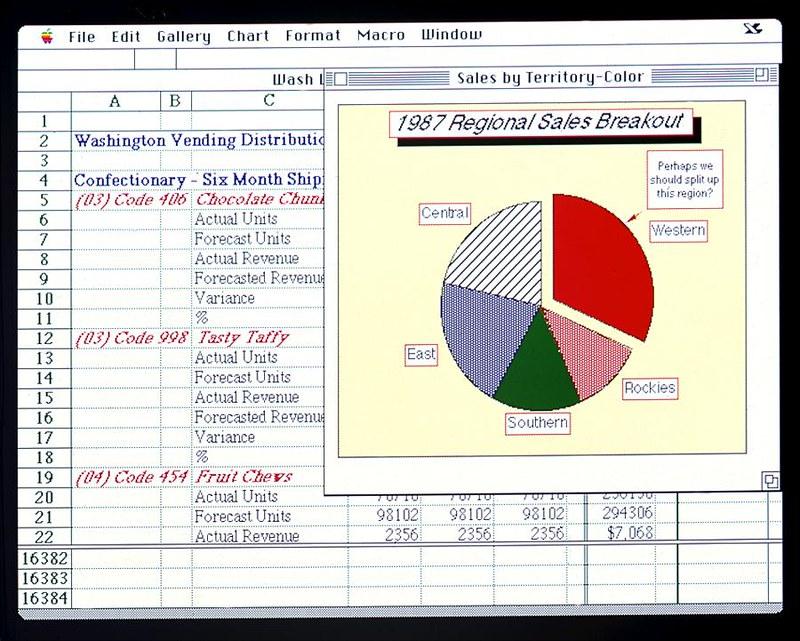
One of Excel’s most powerful features is its ability to create visually appealing charts and graphs. To create a chart, select the data range you want to visualize, then click on the Insert tab and choose your desired chart type. Excel offers a variety of chart types, including column, line, pie, and bar charts. You can customize your chart by adding titles, data labels, and legends. Charts are a great way to present your data in a more digestible format.
5. Advanced Techniques and Tips:
As you become more comfortable with Excel, you can explore advanced techniques to enhance your productivity. These may include using pivot tables to summarize and analyze large datasets, creating conditional formatting to highlight specific values, or using VLOOKUP to search for data in other worksheets. Remember to practice and experiment with these features to fully grasp their potential.

Understanding the Excel Interface
Excel is a widely used spreadsheet program that allows you to organize and analyze data effectively. To fully utilize its features, it’s important to understand the Excel interface. By familiarizing yourself with the various components of the interface, you’ll be able to navigate the program more efficiently and perform tasks with ease.
The Excel interface consists of a number of elements that help you navigate and manipulate data. The main components include:
- Ribbon: Located at the top of the screen, the ribbon contains all the commands and tools you need to work with your data. It is organized into tabs, such as Home, Insert, Formulas, and more, each containing relevant commands and options.
- Workbook: A workbook is like a digital notebook where you can store and analyze your data. It consists of individual worksheets, also known as spreadsheets, which are organized into tabs at the bottom of the screen.
- Cell: The basic unit of data in Excel is a cell, represented by the intersection of a column and row. Cells store data, such as text, numbers, or formulas, and can be formatted to display different types of content.
- Formula Bar: Located just below the ribbon, the formula bar displays the contents of the currently selected cell. It allows you to enter and edit formulas, which can perform calculations and manipulate data.
- Quick Access Toolbar: The Quick Access Toolbar is a customizable toolbar that provides easy access to frequently used commands. By default, it contains commands like Save, Undo, Redo, and more. You can add or remove commands to suit your needs.
To interact with the Excel interface, you can use both the mouse and keyboard shortcuts. For example, you can click on a cell to select it or use arrow keys to navigate through cells. Keyboard shortcuts, such as Ctrl+C to copy and Ctrl+V to paste, can help you perform tasks more efficiently. To discover and remember Excel shortcuts, you can refer to the built-in list of keyboard shortcuts or create your own.
Customizing the Excel interface can also enhance your workflow. For instance, you can change the appearance of the ribbon by minimizing it to show only the tabs, or by customizing the Quick Access Toolbar to include commands you frequently use. Excel also allows you to rearrange worksheets within a workbook, rename tabs, and apply color schemes to improve readability.
In conclusion, is essential for effectively using the program. By familiarizing yourself with the different components and learning how to navigate and customize the interface, you’ll be able to work more efficiently and make the most out of Excel’s powerful features.

Efficient Data Entry Techniques
Paragraph 1:
When it comes to efficiently managing data, Excel is an invaluable tool that can simplify and streamline the process. With its powerful features and functions, mastering Excel can greatly enhance your data entry skills. One of the key techniques for efficient data entry in Excel is using keyboard shortcuts. These shortcuts allow you to quickly navigate through the spreadsheet, select cells, and perform various actions without relying solely on the mouse. By familiarizing yourself with these shortcuts, you can save precious time and improve your productivity.
Paragraph 2:
Another effective data entry technique in Excel is utilizing autofill. Autofill is a handy feature that allows you to automatically fill a series of cells with data, such as numbers, dates, or even custom lists. To use autofill, simply enter the desired value in the first cell, select the cell, and drag the fill handle (the small square at the bottom-right corner of the cell) across the range of cells you want to autofill. This can be a huge time-saver when dealing with long lists or recurring patterns in your data.
Paragraph 3:
Conditional formatting is a powerful tool in Excel that can significantly enhance the visual appeal and readability of your data. By formatting cells based on specific rules or conditions, you can quickly identify trends, outliers, or other important information within your dataset. For example, you can highlight cells that contain values above or below a certain threshold, or apply color scales to visualize the relative magnitude of data points. Utilizing conditional formatting can make your data entry process more efficient and aid in data analysis.
Paragraph 4:
To keep your data organized and easily accessible, Excel provides various options for sorting and filtering. Sorting allows you to arrange data in ascending or descending order based on a chosen column, making it easier to locate specific information or analyze trends. Additionally, filtering enables you to display only the data that meets certain criteria, hiding irrelevant rows or columns. By efficiently sorting and filtering your data, you can focus on the information that matters most and efficiently perform data entry tasks.
Paragraph 5:
Lastly, Excel offers the convenience of using templates, which are pre-designed spreadsheets with built-in formulas and formatting. Templates are particularly useful for repetitive data entry tasks, such as maintaining an inventory or tracking expenses. By utilizing these pre-made templates, you can save time, reduce manual errors, and ensure consistency in your data entry. Whether you’re a beginner or an advanced user, taking advantage of Excel templates can significantly enhance your efficiency and organization in data entry.
With these in Excel, you can streamline your workflow, save time, and improve the accuracy of your data. By mastering keyboard shortcuts, utilizing autofill and conditional formatting, and leveraging sorting, filtering, and templates, you can become a proficient Excel user and handle your data entry tasks with confidence.
Mastering Formulas and Functions
Excel is a powerful tool that can help you analyze and manipulate data with ease. To fully utilize its capabilities, it’s essential to understand and master formulas and functions. These powerful features enable you to perform complex calculations and automate tasks, saving you time and effort. In this post, we will explore various formulas and functions in Excel and learn how to use them effectively.
1. Understanding Formulas:
Formulas are the backbone of Excel, allowing you to perform calculations and make sense of your data. They consist of mathematical operators, cell references, and functions. To create a formula, start with an equal sign (=) followed by the desired expression. You can use arithmetic operators like +, -, *, and /, as well as parentheses to control the order of calculations. Cell references, represented by column letter and row number (e.g., A1), allow you to use the values of other cells in your formulas.
2. Useful Functions:
Excel offers a wide range of built-in functions that can simplify complex calculations and data analysis. Functions are predefined formulas designed to perform specific tasks. From basic arithmetic functions like SUM and AVERAGE to more advanced ones like VLOOKUP and IF, there’s a function for almost every need. By mastering these functions, you can quickly analyze and manipulate your data without the need for lengthy and complex formulas.
3. Nested Functions:
One of the most powerful features of Excel is the ability to nest functions, which means using one function as an argument within another function. This allows you to combine multiple functions and create complex calculations. By breaking down a large problem into smaller, manageable steps, nested functions can help you perform intricate calculations with ease. Take some time to explore the different functions available in Excel and experiment with nesting them to unleash your spreadsheet superpowers.
4. Tips and Tricks:
Excel is full of hidden gems and handy shortcuts that can boost your productivity. Here are a few tips and tricks to help you become an Excel pro:
- Use AutoFill to quickly populate a series of values or formulas.
- Find and replace specific data values or formulas using the Search and Replace function.
- Use named ranges to make your formulas easier to understand and manage.
- Apply conditional formatting to highlight important data points or trends.
- Utilize data validation to ensure the accuracy of input and prevent errors.
5. Practice Makes Perfect:
The key to in Excel is practice. As with any new skill, the more you practice, the better you become. Dedicate some time to working with different formulas and functions, and challenge yourself to solve complex problems. Excel’s extensive resources, such as online tutorials and forums, can help you deepen your knowledge and discover new tricks. Remember, the more you explore and experiment, the more confident and proficient you will become in using Excel’s formulas and functions.

Advanced Data Analysis with Excel
Excel is a powerful tool that goes far beyond just simple spreadsheet calculations. With its advanced features for data analysis, you can uncover valuable insights and make better-informed decisions. In this post, we will explore how to leverage Excel’s capabilities for advanced data analysis.
PivotTables: PivotTables are a fantastic feature that allows you to summarize, analyze, and explore large amounts of data quickly. By dragging and dropping fields, you can create custom reports and gain a deeper understanding of your data. Whether you need to analyze sales trends, customer behavior, or financial performance, PivotTables can help you transform raw data into actionable insights.
Conditional Formatting: One of Excel’s most powerful features is conditional formatting. This feature allows you to apply formatting rules to cells based on their values, making it easy to identify trends, outliers, or anomalies in your data. Highlighting cells that meet specific criteria can help you spot patterns or errors at a glance, saving you time and effort.
Data Validation: Ensuring data accuracy is crucial for any analysis. Excel’s data validation feature allows you to set specific rules for data input, reducing the risk of errors or inconsistencies. You can define limits, validations, or even create custom input messages to guide users in entering the correct data. Data validation helps maintain data integrity and improves the reliability of your analysis.
What-If Analysis: Excel provides powerful what-if analysis tools, such as Goal Seek and Scenario Manager, which allow you to explore different scenarios and understand the potential outcomes. With Goal Seek, you can determine what input value is needed to achieve a desired result, while Scenario Manager allows you to create and compare multiple scenarios based on different assumptions. These tools help you make informed decisions and understand the impact of various factors on your data.
Statistical Functions: Excel offers a wide range of built-in statistical functions that enable you to perform advanced data analysis. Whether you need to calculate averages, correlations, regressions, or conduct hypothesis testing, Excel has you covered. These functions provide valuable insights into your data and allow you to make data-driven decisions. Combining statistical functions with PivotTables or charts can unlock even more powerful analysis capabilities.
In conclusion, Excel’s advanced data analysis features go beyond its reputation as a simple spreadsheet tool. With PivotTables, conditional formatting, data validation, what-if analysis, and statistical functions, you can unlock a world of insights and make better decisions based on your data. Become familiar with these features, and Excel will become your go-to tool for advanced data analysis.
Q&A
Q: What is Excel and how is it used?
A: Excel is a powerful spreadsheet program created by Microsoft. It allows users to organize, analyze and store large amounts of data efficiently. You can use Excel to perform calculations, create charts and graphs, create budgets and financial models, and much more.
Q: How do I start using Excel?
A: To start using Excel, you need to have the software installed on your computer. Once installed, you can launch Excel by clicking on the program icon. Alternatively, you can open Excel files directly from your file explorer. Excel files have a .xlsx extension.
Q: How do I input data into Excel?
A: To input data into Excel, you need to select a cell where you want to enter the data. Then simply type the data into the selected cell. You can navigate through different cells by using the arrow keys or the tab key. Remember to press Enter or Return to confirm the data entry.
Q: How can I format data in Excel?
A: Excel provides various formatting options to enhance the presentation and organization of your data. To format cells, you can select a range of cells and use the options in the “Home” tab. These options include changing font styles, adjusting cell alignment, changing cell borders, and applying conditional formatting for highlighting data.
Q: Can Excel perform calculations and formulas?
A: Yes, Excel can perform a wide range of calculations and formulas. To use formulas, simply select the cell where you want the result to appear, start with an equals sign (=), and input the formula. For example, to add two numbers in cells A1 and B1, you can type “=A1+B1”. Excel supports a variety of mathematical, statistical, and logical functions, such as SUM, AVERAGE, IF, and many more.
Q: How can I create charts and graphs in Excel?
A: Excel provides an easy way to create charts and graphs based on your data. First, select the data range you want to include in the chart. Then, go to the “Insert” tab and select the desired chart type from the “Charts” section. You can choose from options like column, line, pie charts, and more. Excel will automatically generate the chart for you to customize and format as needed.
Q: Can Excel be used for data analysis?
A: Absolutely! Excel offers various tools for data analysis. The “Data” tab includes features such as sorting, filtering, and pivot tables which can quickly summarize and organize large datasets. In addition, Excel supports advanced functions like VLOOKUP and INDEX-MATCH that enable data manipulation and retrieval, making it a powerful tool for data analysis.
Q: Are there any online resources available to enhance Excel skills?
A: Yes, there are numerous online resources available to enhance your Excel skills. Microsoft offers extensive documentation, tutorials, and training courses on their website. Additionally, there are many online platforms, YouTube channels, and communities dedicated to Excel, such as ExcelJet, ExcelIsFun, and MrExcel, where you can find useful tips, tricks, and examples to improve your proficiency. In conclusion, mastering the art of using Excel can tremendously enhance your efficiency and productivity in handling data and performing complex calculations. From basic functions such as organizing information and creating simple formulas, to advanced features like conditional formatting and data analysis, Excel offers a wide array of tools to simplify your tasks. By taking the time to familiarize yourself with the various functions and formulas, you can unleash Excel’s full potential and streamline your work processes. Remember to practice regularly and explore new techniques to continually improve your proficiency with Excel. With patience and determination, you’ll soon become a proficient Excel user, capable of tackling any data-related challenge that comes your way. So go ahead, dive into the world of Excel, and unlock endless possibilities for efficient data management and analysis.


